Running NANDFlashSim

This command line will run NANDFlashSim with a NAND flash memory system, which has eight dies (Octal Die Package), two plane two planes, eight I/O bus pins, 1 clock period. Other configurations related to simulation environment and device specific statistics are referred by nfs_simulenv.ini and Micron_MLC.ini respectively. To better understand ini files and command lines, please see the configuration section.
Output
Below, we have provided a detailed explanation of the simulator output.

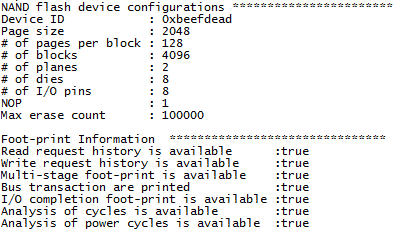
From the beginning of output, you can check information related to the simulation tested such as the device information and environment information (logging files). Logging files include response time, cycles for different activities and NAND stages, and I/O request histories. If you specified the flag for printing log files on your command line or in environment ini file, you can find the log files from logData folder created under your project working directory.

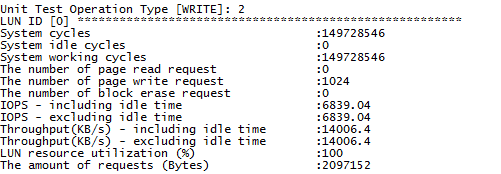
NANDFlashSim provides overall system performance in terms of bandwidth and system cycles. Also, in the system performance reports, system utilization and request analysis are briefly included.
After that, NANDFlashSim reports detail information for each NAND flash die. In this report section, system performances in terms of bandwidth and IOPS are available, and also information related to I/O parallelization such as idle time, resource contention and utilization is available. Users can identify each dies using its die id. The full die-level information is as follows:

Logs
As the flag (for logs) that you specified in the command line, you can find the log files. These log files allow you to look into NAND flash internals more closely.

For an instance, users are able to check I/O completion information in the host-level perspective. In the below figure, we can look first three I/O requests, which arrive 0 cycle simultaneously. It also includes current cycle, which means the system time when NANDFlashSim footprint the I/O completion information, and latency in terms of cycle. I/O requests are identified by transaction id.

